
The dataset obtained from the NDAP (National Data Analytics Portal) of India spans from 2006 to 2021 and provides a comprehensive overview of grid-connected renewable energy capacity across various states. It comprises four main columns: State, Year, Type of Renewable Energy, and Capacity of Grid-Connected Renewable Energy Generated, alongside a percentage growth column. This dataset encapsulates the dynamic landscape of renewable energy adoption in India, offering insights into the geographic distribution, temporal trends, and the relative contributions of different renewable energy sources. With state-level granularity, it enables us to analyze regional disparities, identify growth hotspots, and assess the effectiveness of policies promoting clean energy.
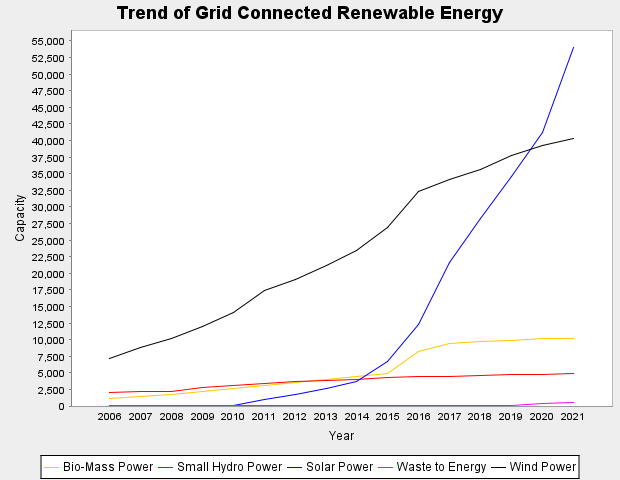
Wind power capacity has been increasing steadily throughout the country since 2006. Solar power was not much popular up until 2010, following which there was a steep increase in solar power production. BioMass power has had a feeble rate of increase since 2006, but a sharp increase is seen during 2015, possibly due to innovations in the field. Contributions of small hydro power have been stagnant. This could be due to widespread protests and large scale displacement of people required for setting up necessary infrastructure. Waste to energy has more or less been the least contributor of the five throughout the 15 years.
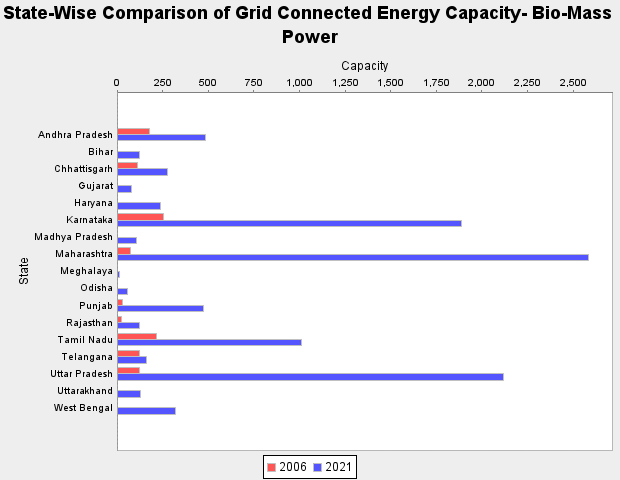
Back in 2006, Karnataka was the leading bio-mass power generating state. However it was usurped from its position by Maharasthra by 2021
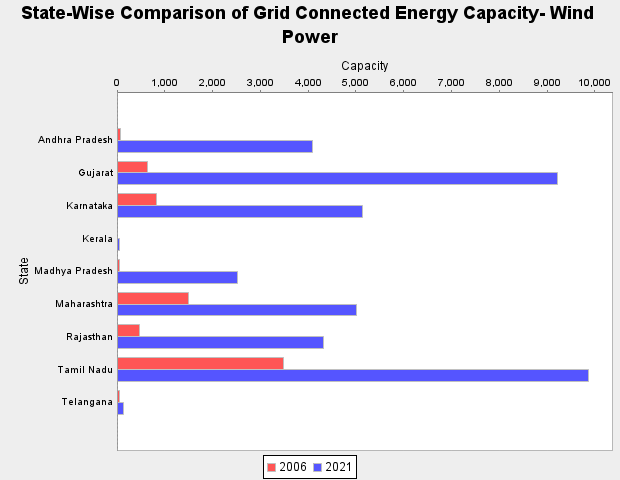
Tamil Nadu always had the upperhand in Wind energy, as it's a coastal state. What we should not ignore is the growth of Wind energy generation in Gujarat, which grew tremendously.
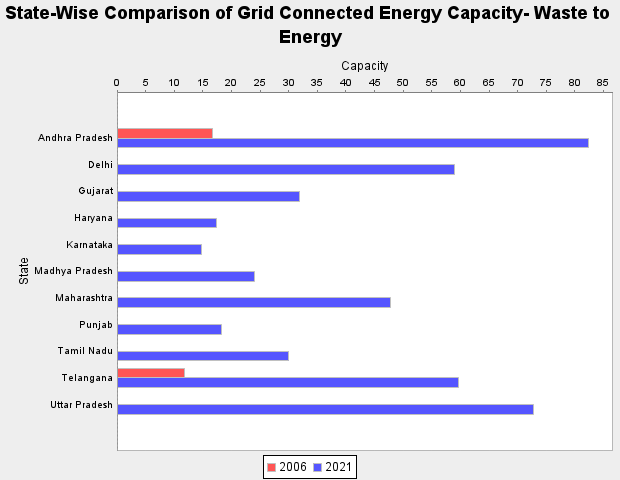
In 2006, only 2 states had proper systems to convert waste to energy. India has come a long way since, and even though it is not the most utilized source of energy, it has been embraced by multiple states with Andhra Pradhesh coming out on top.
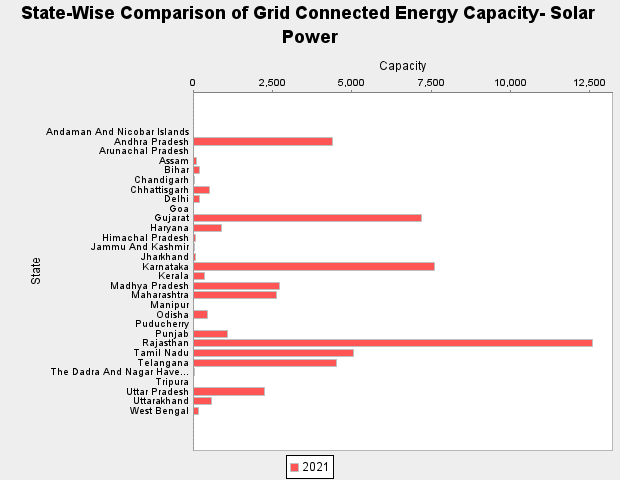
We can see that there was negligible amount of solar power produced in 2006. There was a tremendous growth in solar power generation since.
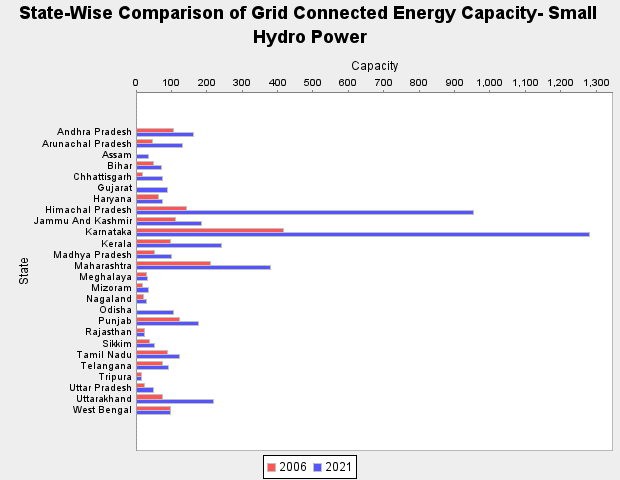
Along with energy generated from waste, small hydro power generation was another energy source whose capacity grew at a very slow pace. Very few states have increased their energy production, while some states have not bothered to increase them at all. This could be because of the widespread protests, displacement and habitat loss that such projects bring about.
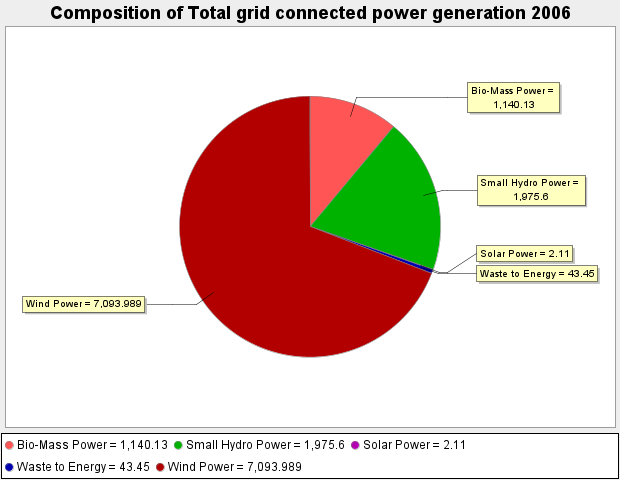
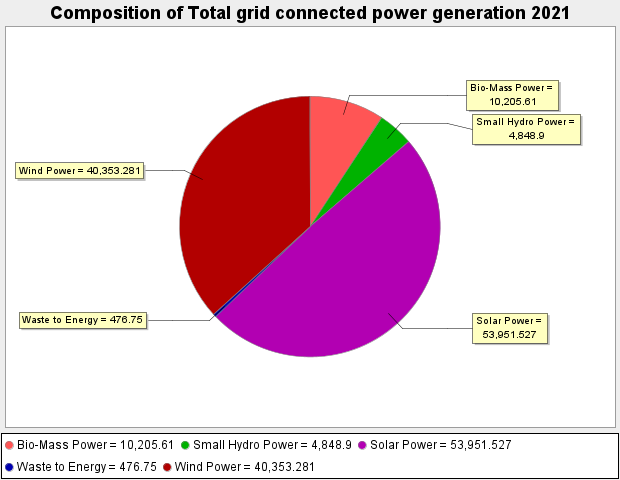
In 2006, a major contribution of renewable energy was produced using Wind Power, followed by Small Hydro Power. There has been a stark difference in this during the course of 15 years where in 2021, Solar power is the leading renewable energy source connected to the grid.
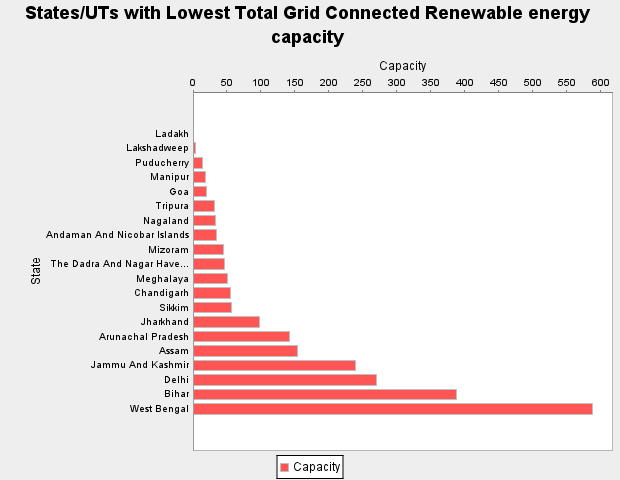
States/UTs with the lowest production of renewable energy can be seen in this plot. It should be noted that these are absolute values - we have not considered the size or population of these regions. However, it is interesting to note that there are some larger states whose adoption of renewable energy is in the range as that of regions that are much smaller than them.